X-band Downlink Interference Analysis at Svalbard
This notebook demonstrates interference analysis between two constellations sharing the X-band downlink spectrum, received at the Svalbard Satellite Station (SvalSat).
Scenario
Victim constellation: 2 satellites at 700 km SSO, LTAN 10:30, -70 dBW/Hz PSD, isotropic TX
Interfering constellation: 4 satellites at 550 km SSO, LTAN 11:00, -65 dBW/Hz PSD, isotropic TX
Victim receiver: 5.4 m parabolic dish at Svalbard (78.229°N / 15.407°E)
Centre frequency: 8200 MHz (X-band)
Interference threshold: -237 dBW/Hz
Analysis window: 90 days (2025-01-01 to 2025-04-01)
Interference events occur when an interfering satellite is visible to the Svalbard antenna at the same time as a victim satellite, and the received interferer PSD exceeds the threshold.
[1]:
import numpy as np
import matplotlib.pyplot as plt
import matplotlib.dates as mdates
from datetime import datetime

from missiontools import Spacecraft, GroundStation, IsotropicAntenna
from missiontools.comm import InterferenceAnalysis, SymmetricAntenna
from missiontools.attitude import ConditionAttitudeLaw, TrackAttitudeLaw
from missiontools.condition import SpaceGroundAccessCondition
1. Victim Constellation
Two spacecraft at 700 km in sun-synchronous orbit with a 10:30 LTAN. The two satellites are separated by 180° in mean anomaly.
[2]:
EPOCH = np.datetime64('2025-01-01T00:00:00', 'us')

vtx_ant_1 = IsotropicAntenna()
vtx_ant_2 = IsotropicAntenna()

vtx_sc_1 = Spacecraft.sunsync(
    altitude_km=700.0,
    node_solar_time='10:30',
    node_type='ascending',
    epoch=EPOCH,
    ma_deg=0.0,
)
vtx_sc_1.add_antenna(vtx_ant_1)

vtx_sc_2 = Spacecraft.sunsync(
    altitude_km=700.0,
    node_solar_time='10:30',
    node_type='ascending',
    epoch=EPOCH,
    ma_deg=180.0,
)
vtx_sc_2.add_antenna(vtx_ant_2)

print(f'Victim SC-1: alt={700} km, i={np.degrees(vtx_sc_1.i):.2f}°, period={2*np.pi*np.sqrt(vtx_sc_1.a**3/vtx_sc_1.central_body_mu)/60:.1f} min')
print(f'Victim SC-2: alt={700} km, i={np.degrees(vtx_sc_2.i):.2f}°, period={2*np.pi*np.sqrt(vtx_sc_2.a**3/vtx_sc_2.central_body_mu)/60:.1f} min')
Victim SC-1: alt=700 km, i=98.19°, period=98.8 min
Victim SC-2: alt=700 km, i=98.19°, period=98.8 min
2. Interfering Constellation
Four spacecraft at 550 km in sun-synchronous orbit with an 11:00 LTAN. The satellites are evenly spaced at 0°, 90°, 180°, 270° in mean anomaly.
[3]:
itx_ants = [IsotropicAntenna() for _ in range(4)]
itx_scs = []

for k in range(4):
    sc = Spacecraft.sunsync(
        altitude_km=550.0,
        node_solar_time='11:00',
        node_type='ascending',
        epoch=EPOCH,
        ma_deg=k * 90.0,
    )
    sc.add_antenna(itx_ants[k])
    itx_scs.append(sc)

print(f'Interfering constellation: {len(itx_scs)} satellites')
print(f'  alt=550 km, i={np.degrees(itx_scs[0].i):.2f}°, period={2*np.pi*np.sqrt(itx_scs[0].a**3/itx_scs[0].central_body_mu)/60:.1f} min')
Interfering constellation: 4 satellites
  alt=550 km, i=97.59°, period=95.6 min
3. Victim Receiver (Svalbard)
A 5.4 m parabolic dish antenna at SvalSat. The antenna uses a ConditionAttitudeLaw to track whichever victim spacecraft is currently visible: SpaceGroundAccessCondition gates TrackAttitudeLaw instances for each victim SC. When neither is visible the dish falls back to tracking the first victim SC (the pointing direction is irrelevant during those periods). The antenna pattern uses the parabolic envelope model at 8200 MHz.
[4]:
svalbard = GroundStation(lat=78.229, lon=15.407, alt=500.0)

cond_vtx1 = SpaceGroundAccessCondition(vtx_sc_1, svalbard, el_min_deg=5.0)
cond_vtx2 = SpaceGroundAccessCondition(vtx_sc_2, svalbard, el_min_deg=5.0)

gs_law = ConditionAttitudeLaw(
    default_attitude=TrackAttitudeLaw(vtx_sc_1),
    condition_attitudes=[
        (cond_vtx1, TrackAttitudeLaw(vtx_sc_1)),
        (cond_vtx2, TrackAttitudeLaw(vtx_sc_2)),
    ],
)

rx_dish = SymmetricAntenna.from_parabolic(
    diameter=5.4,
    frequency=8200e6,
    eff=0.6,
    envelope=True,
    attitude_law=gs_law,
)
svalbard.add_antenna(rx_dish)

print(f'Ground station : SvalSat ({svalbard.lat}\u00b0N, {svalbard.lon}\u00b0E, {svalbard.alt:.0f} m)')
print(f'Dish diameter  : 5.4 m')
print(f'Peak gain      : {rx_dish.peak_gain_dbi:.1f} dBi')
print(f'Antenna law    : ConditionAttitudeLaw (tracks victim SCs when visible)')
Ground station : SvalSat (78.229°N, 15.407°E, 500 m)
Dish diameter  : 5.4 m
Peak gain      : 51.1 dBi
Antenna law    : ConditionAttitudeLaw (tracks victim SCs when visible)
4. Build Interference Analysis
Register all transmitters and receivers, then run the 90-day computation. A max_step of 30 s is used for access interval detection, and an event_step of 5 s for PSD sampling within candidate interference windows.
[5]:
T_START = np.datetime64('2025-01-01T00:00:00', 'us')
T_END   = np.datetime64('2025-04-01T00:00:00', 'us')

PSD_THRESHOLD = -237.0  # dBW/Hz
F_MHZ = 8200.0         # MHz
VICTIM_TX_PSD = -70.0  # dBW/Hz
INTERFERER_TX_PSD = -65.0  # dBW/Hz

ia = InterferenceAnalysis(f_MHz=F_MHZ)

ia.add_victim_tx('VTX-1', vtx_ant_1, VICTIM_TX_PSD)
ia.add_victim_tx('VTX-2', vtx_ant_2, VICTIM_TX_PSD)

ia.add_victim_rx('Svalbard', rx_dish)

for k, ant in enumerate(itx_ants):
    ia.add_interfering_tx(f'ITX-{k+1}', ant, INTERFERER_TX_PSD)

print(f'Analysis period : {str(T_START)[:10]} to {str(T_END)[:10]} (90 days)')
print(f'Frequency       : {F_MHZ:.0f} MHz')
print(f'PSD threshold   : {PSD_THRESHOLD} dBW/Hz')
print(f'Victim TXs      : {len(ia._victim_txs)}')
print(f'Victim RXs      : {len(ia._victim_rxs)}')
print(f'Interfering TXs : {len(ia._interfering_txs)}')
print(f'Total triples   : {len(ia._victim_txs) * len(ia._victim_rxs) * len(ia._interfering_txs)}')
Analysis period : 2025-01-01 to 2025-04-01 (90 days)
Frequency       : 8200 MHz
PSD threshold   : -237.0 dBW/Hz
Victim TXs      : 2
Victim RXs      : 1
Interfering TXs : 4
Total triples   : 8
[6]:
events, access_totals = ia.compute(
    psd_threshold=PSD_THRESHOLD,
    start_time=T_START,
    end_time=T_END,
    max_step=30.0,
    event_step=5.0,
)

print(f'Interference events detected: {len(events)}')
Interference events detected: 224
5. Summary
[7]:
total_interference_s = 0
for ev in events:
    dur = int((ev['end_time'] - ev['start_time']) / np.timedelta64(1, 's'))
    total_interference_s += dur

window_s = int((T_END - T_START) / np.timedelta64(1, 's'))

print('=' * 60)
print('  INTERFERENCE ANALYSIS SUMMARY')
print('=' * 60)
print(f'  Analysis period        : {str(T_START)[:10]} to {str(T_END)[:10]}')
print(f'  Duration               : {window_s / 86400:.0f} days')
print(f'  Centre frequency       : {F_MHZ:.0f} MHz')
print(f'  PSD threshold          : {PSD_THRESHOLD} dBW/Hz')
print(f'  ---')
print(f'  Total events           : {len(events)}')
print(f'  Total interference     : {total_interference_s:.0f} s '
      f'({total_interference_s / 3600:.2f} h)')
print(f'  Percentage of window   : {total_interference_s / window_s * 100:.4f}%')
if events:
    max_psd = max(ev['max_interferer_psd'] for ev in events)
    print(f'  Peak interferer PSD    : {max_psd:.1f} dBW/Hz')
    durs = [int((ev['end_time'] - ev['start_time']) / np.timedelta64(1, 's')) for ev in events]
    print(f'  Mean event duration    : {np.mean(durs):.0f} s ({np.mean(durs)/60:.1f} min)')
    print(f'  Max event duration     : {max(durs)} s ({max(durs)/60:.1f} min)')
    print(f'  Min event duration     : {min(durs)} s ({min(durs)/60:.1f} min)')
print('=' * 60)
============================================================
  INTERFERENCE ANALYSIS SUMMARY
============================================================
  Analysis period        : 2025-01-01 to 2025-04-01
  Duration               : 90 days
  Centre frequency       : 8200 MHz
  PSD threshold          : -237.0 dBW/Hz
  ---
  Total events           : 224
  Total interference     : 44020 s (12.23 h)
  Percentage of window   : 0.5661%
  Peak interferer PSD    : -189.4 dBW/Hz
  Mean event duration    : 197 s (3.3 min)
  Max event duration     : 471 s (7.8 min)
  Min event duration     : 0 s (0.0 min)
============================================================
6. Events by Interfering Satellite
[8]:
from collections import defaultdict

by_itx = defaultdict(list)
for ev in events:
    by_itx[ev['interfering_tx']].append(ev)

print(f"  {'Satellite':>12}  {'Events':>7}  {'Duration':>12}  {'Peak PSD':>10}")
print(f"  {'\u2500'*12}  {'\u2500'*7}  {'\u2500'*12}  {'\u2500'*10}")

for name in sorted(by_itx):
    evs = by_itx[name]
    dur = sum(int((e['end_time'] - e['start_time']) / np.timedelta64(1, 's')) for e in evs)
    peak = max(e['max_interferer_psd'] for e in evs)
    print(f'  {name:>12}  {len(evs):>7}  {dur // 60:>5d}m {dur % 60:02d}s  {peak:>9.1f} dBW/Hz')

print(f"  {'\u2500'*12}  {'\u2500'*7}  {'\u2500'*12}  {'\u2500'*10}")
total_dur = sum(int((e['end_time'] - e['start_time']) / np.timedelta64(1, 's')) for e in events)
overall_peak = max(e['max_interferer_psd'] for e in events) if events else float('nan')
print(f'  {"TOTAL":>12}  {len(events):>7}  {total_dur // 60:>5d}m {total_dur % 60:02d}s  {overall_peak:>9.1f} dBW/Hz')
     Satellite   Events      Duration    Peak PSD
  ────────────  ───────  ────────────  ──────────
         ITX-1       56    182m 27s     -189.4 dBW/Hz
         ITX-2       56    187m 29s     -189.4 dBW/Hz
         ITX-3       55    182m 13s     -189.4 dBW/Hz
         ITX-4       57    181m 31s     -189.6 dBW/Hz
  ────────────  ───────  ────────────  ──────────
         TOTAL      224    733m 40s     -189.4 dBW/Hz
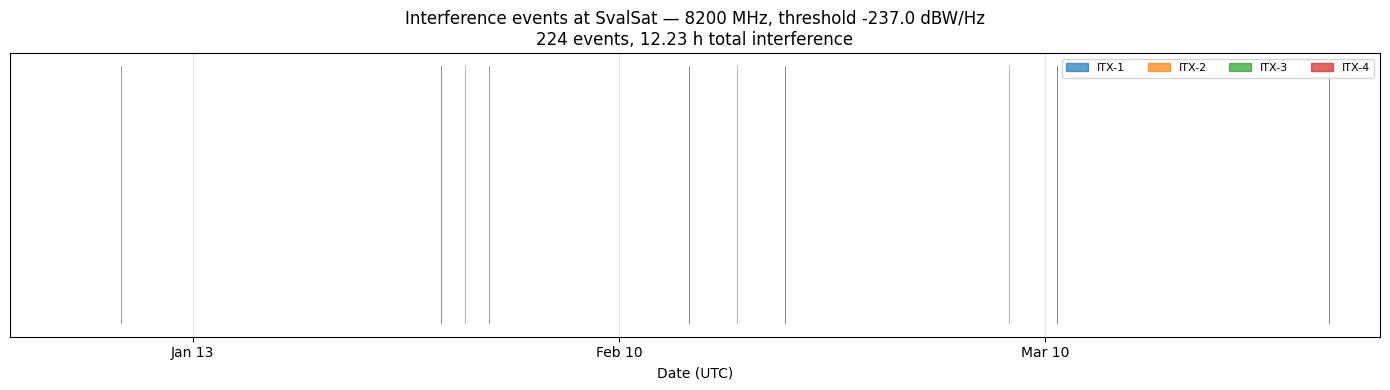
7. Interference Event Timeline
Each bar represents one interference event, coloured by the interfering satellite.
[9]:
def to_dt(t64):
    return t64.astype('datetime64[ms]').astype(datetime)

itx_names_sorted = sorted(by_itx)
color_map = {name: f'C{k}' for k, name in enumerate(itx_names_sorted)}

fig, ax = plt.subplots(figsize=(14, 4))

for ev in events:
    ax.barh(
        0,
        left=to_dt(ev['start_time']),
        width=to_dt(ev['end_time']) - to_dt(ev['start_time']),
        height=0.5,
        color=color_map[ev['interfering_tx']],
        alpha=0.7,
    )

handles = [plt.Rectangle((0, 0), 1, 1, color=color_map[n], alpha=0.7) for n in itx_names_sorted]
ax.legend(handles, itx_names_sorted, loc='upper right', ncol=len(itx_names_sorted), fontsize=8)

ax.xaxis.set_major_formatter(mdates.DateFormatter('%b %d'))
ax.xaxis.set_major_locator(mdates.WeekdayLocator(byweekday=mdates.MO, interval=4))
ax.set_yticks([])
ax.set_xlim(to_dt(T_START), to_dt(T_END))
ax.set_xlabel('Date (UTC)')
ax.set_title(
    f'Interference events at SvalSat \u2014 {F_MHZ:.0f} MHz, '
    f'threshold {PSD_THRESHOLD} dBW/Hz\n'
    f'{len(events)} events, {total_interference_s/3600:.2f} h total interference'
)
ax.grid(True, axis='x', alpha=0.3)
plt.tight_layout()
plt.show()
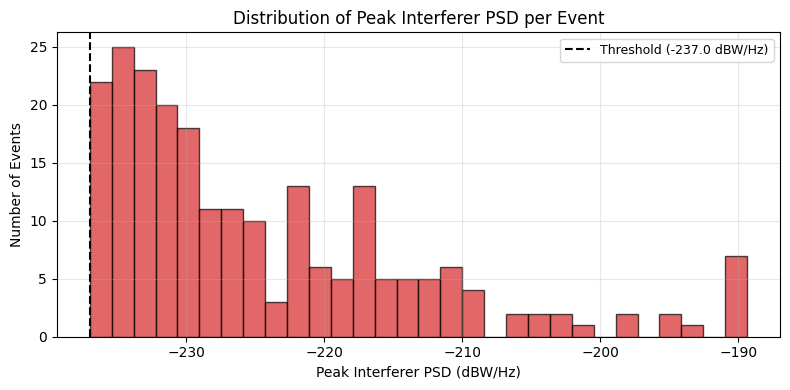
8. Peak Interferer PSD Distribution
[10]:
fig, ax = plt.subplots(figsize=(8, 4))

if events:
    peak_psds = [ev['max_interferer_psd'] for ev in events]
    ax.hist(peak_psds, bins=30, color='tab:red', alpha=0.7, edgecolor='black')
    ax.axvline(PSD_THRESHOLD, color='black', linestyle='--', linewidth=1.5,
               label=f'Threshold ({PSD_THRESHOLD} dBW/Hz)')
    ax.legend(fontsize=9)

ax.set_xlabel('Peak Interferer PSD (dBW/Hz)')
ax.set_ylabel('Number of Events')
ax.set_title('Distribution of Peak Interferer PSD per Event')
ax.grid(True, alpha=0.3)
plt.tight_layout()
plt.show()
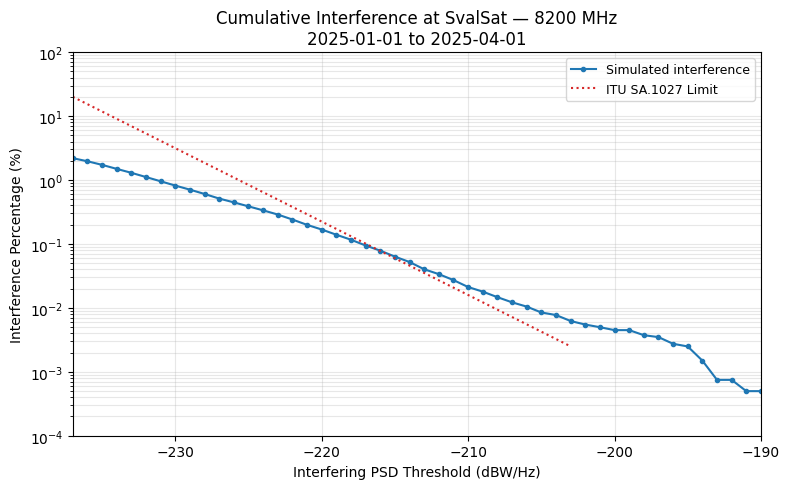
9. Cumulative Interference Percentage
The interference percentage is calculated as the fraction of total condition-filtered victim-link access time during which at least one interferer’s received PSD meets or exceeds each threshold. The ITU SA.1027 interference criterion is overlaid for reference.
[11]:
thresholds = np.arange(-237, -189, 1.0)  # dBW/Hz

pcts = ia.interference_percentage(
    psd_threshold=thresholds,
    victim_tx=['VTX-1', 'VTX-2'],
    victim_rx='Svalbard',
    interfering_tx=[f'ITX-{k+1}' for k in range(4)],
)

fig, ax = plt.subplots(figsize=(8, 5))

ax.semilogy(thresholds, pcts, 'o-', markersize=3, linewidth=1.5,
            color='tab:blue', label='Simulated interference')

itu_psd = np.array([-237.0, -203.0])
itu_pct = np.array([20.0, 0.0025])
ax.semilogy(itu_psd, itu_pct, ':', linewidth=1.5, color='tab:red',
            label='ITU SA.1027 Limit')

ax.set_xlabel('Interfering PSD Threshold (dBW/Hz)')
ax.set_ylabel('Interference Percentage (%)')
ax.set_title(
    f'Cumulative Interference at SvalSat \u2014 {F_MHZ:.0f} MHz\n'
    f'{str(T_START)[:10]} to {str(T_END)[:10]}'
)
ax.set_ylim(1e-4, 100.0)
ax.set_xlim(thresholds[0], thresholds[-1])
ax.legend(fontsize=9)
ax.grid(True, which='both', alpha=0.3)
plt.tight_layout()
plt.show()